Published Jul 27, 2023
25 Most Powerful Account Based Marketing Insights From The FunnelFuel Analytics

In todays post, we’re looking at insights and more specifically insights with an ABM lens applied over the top. In all my years around agencies, adtech, brands and clients directly, and the various teams that service all stakeholders, everyone has always been screaming for more insights. In the world of B2B and Account Based marketing, this remains exactly the same. One key question we get asked is, ‘what insights can I glean from the FunnelFuel ABM analytics?’ – so today we have put together a post with some of the most powerful and most commonly used.
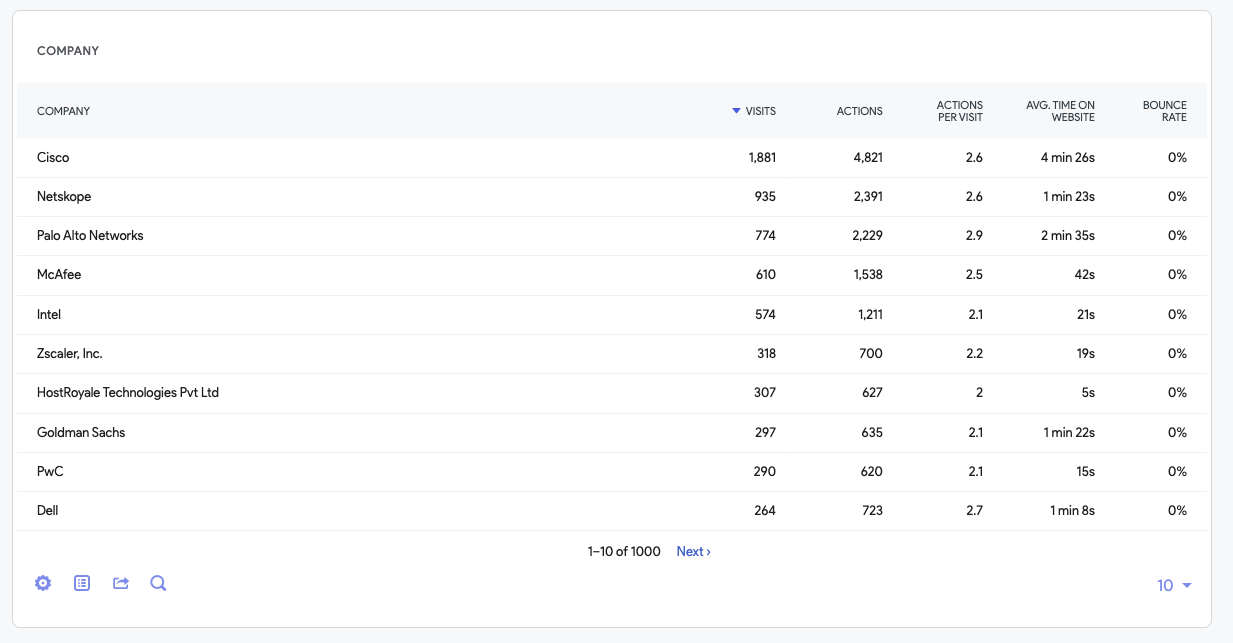
Which companies have been on my website and what have they been doing?
This is a fundamental question which FunnelFuel answers. The below insight shows you which companies have been on your website in a specified time period, as well as how much engagement they have delivered at a company level, measured in attention minutes;
In the view below, we are looking at visits from Microsoft to a website. The below insight shows a global breakdown of the Microsoft traffic, from offices and VPN’s associated with Microsoft;
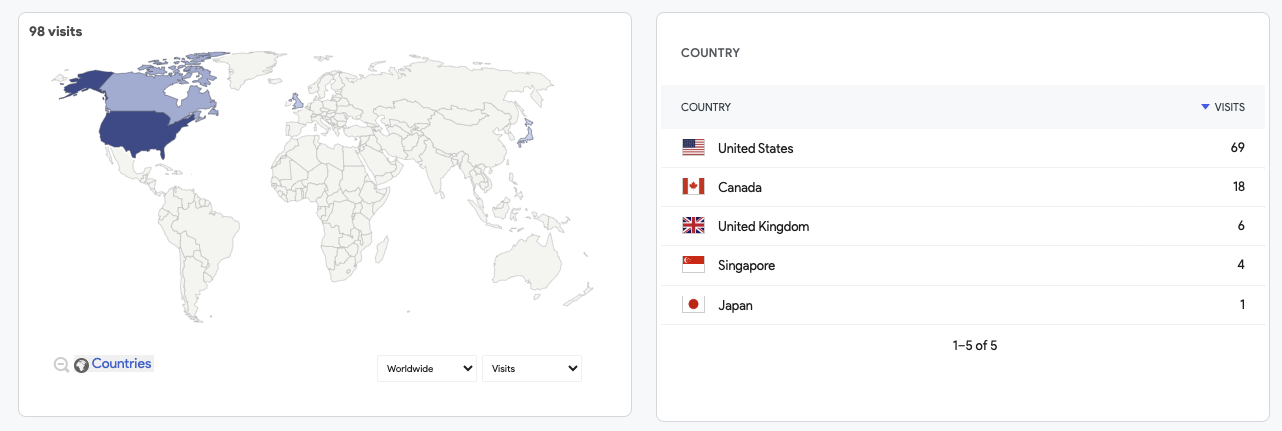
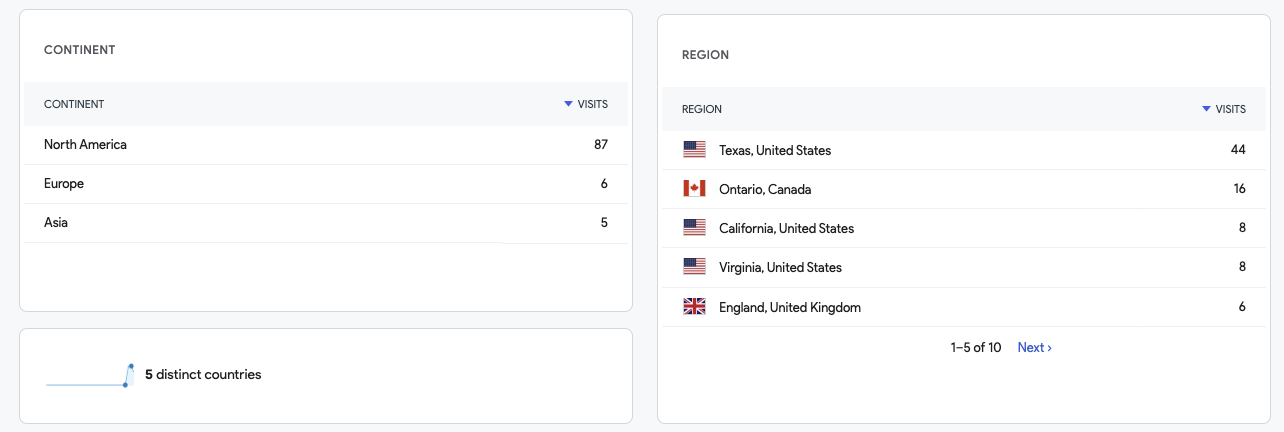
and we can drill into continent, region and distinct countries too;
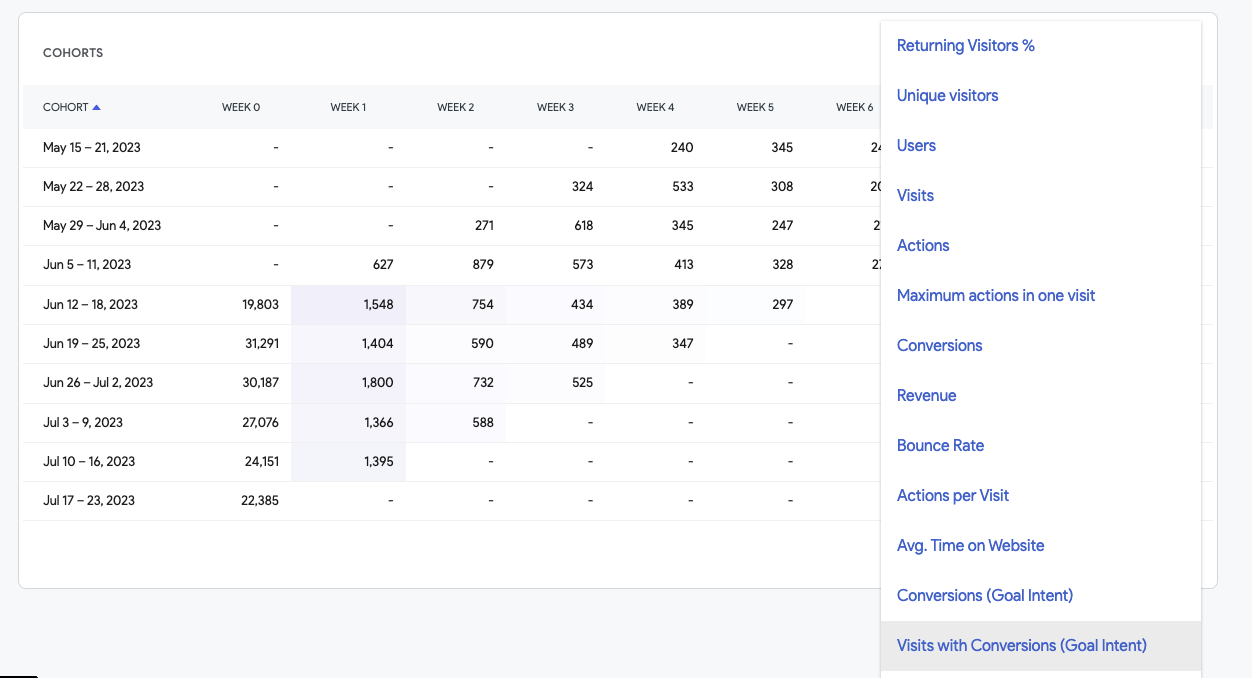
and we can run cohort analysis of visits from named accounts broken into a whole host of trackable events. Below we take a view of Microsoft traffic set against a user defined intent goal (in this case, 30 seconds time on site) and we can see how Microsoft traffic breaks down;
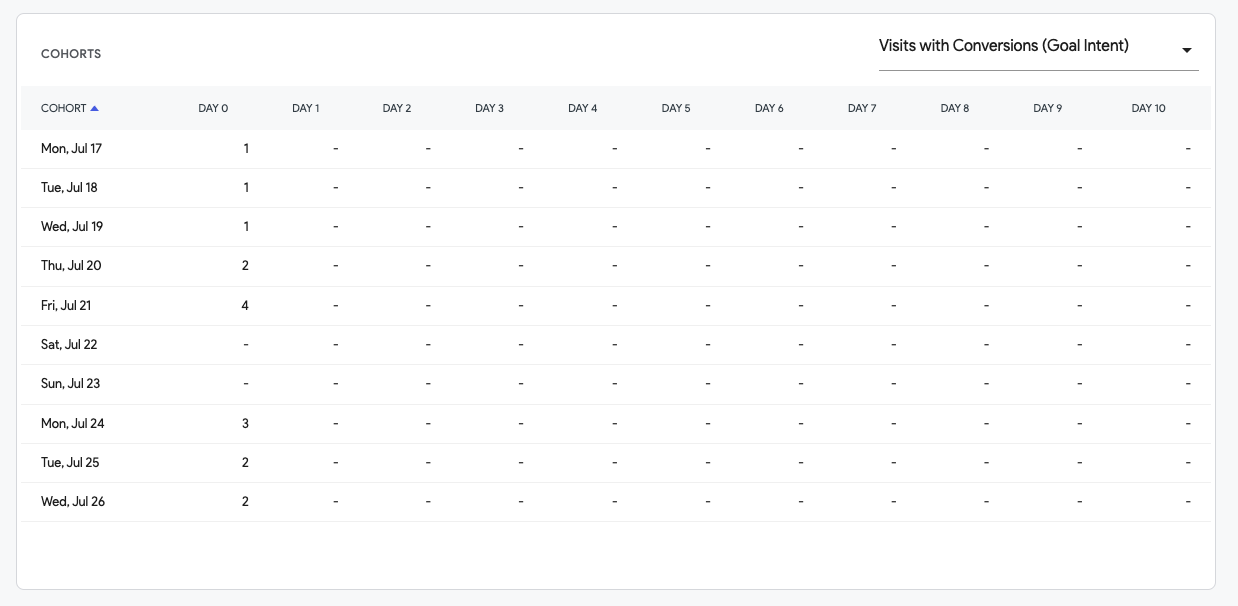
Cohort analysis can be run against a whole array of dimensions;
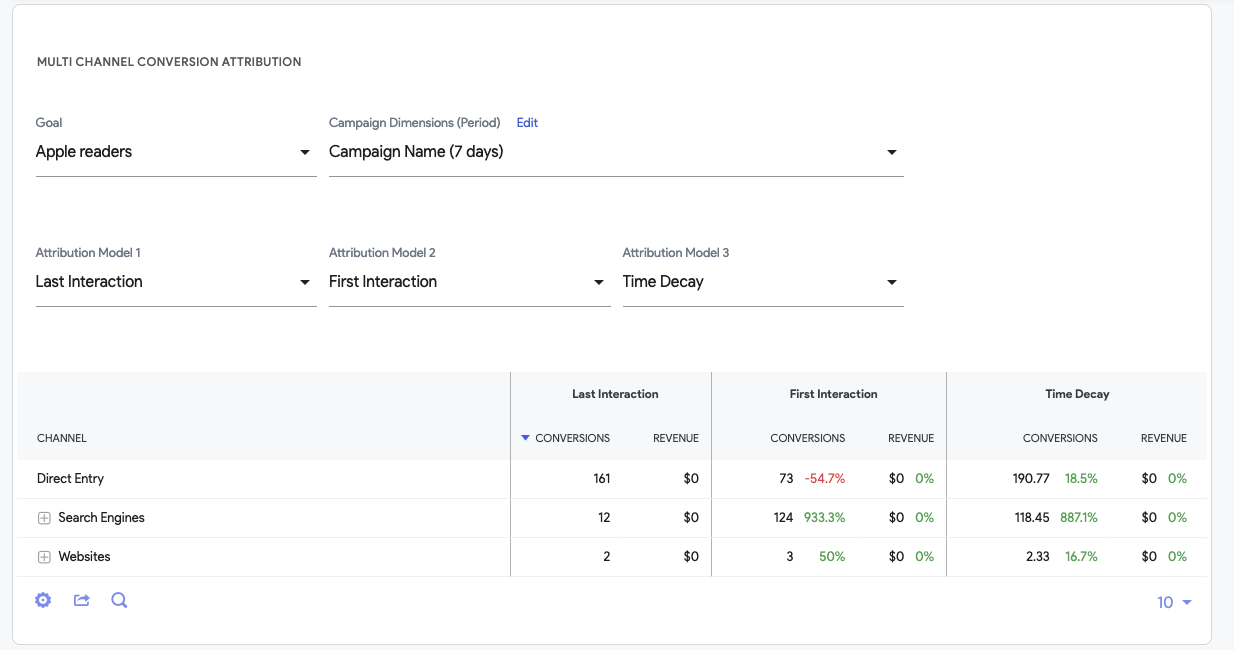
Measure Account Based Goals against 6 attribution models
What insight does this give? FunnelFuel enables you to measure every goal (think any sort of conversion) against 6 different attribution models, giving you a much fuller understanding of how the various marketing channels work together to drive outcomes.
This view can have an account based filter, meaning you can view any goal filtered by any company that has been on your website, and measure that goal against 6 attribution models to get the full picture.
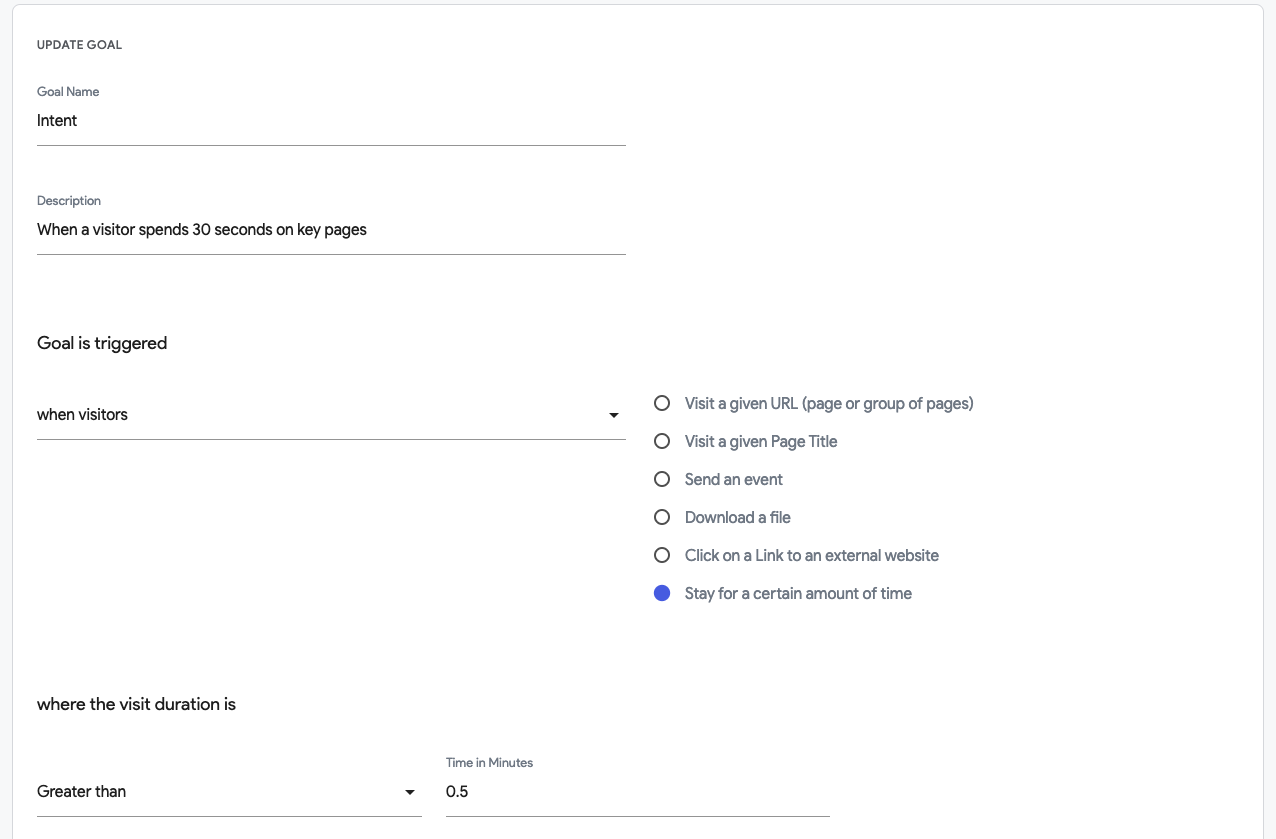
Build your own intent models and measure them at an account level
Every brand has their own idea of what intent looks like, and in different scenarios, at different stages of the funnel, intent can look very different.
FunnelFuel lets you define intent. Whether its visiting a key page (such as a ‘book a demo’) or spending a certain amount of time on pages in the same root folder of your domain (e.g. product led interest), or completing a certain set of events (an event being any action on the page – such as viewing a video, playing audio, expanding javascript to see more content etc).
Build Intent funnels to qualify prospects
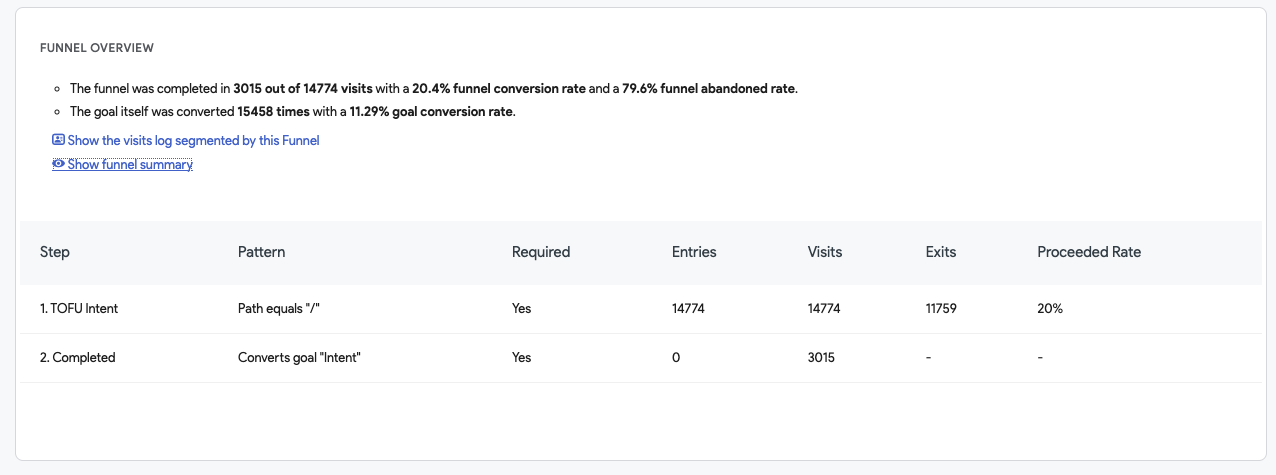
Intent, as we touched on above can be multi-faceted. Sometimes the right intent signals are fired after an account has gone on a specific journey – flowing through numerous individual goals. FunnelFuel lets you build funnel views linked to multi-stepped goals, and shows you where the accounts journey may be dropping off.
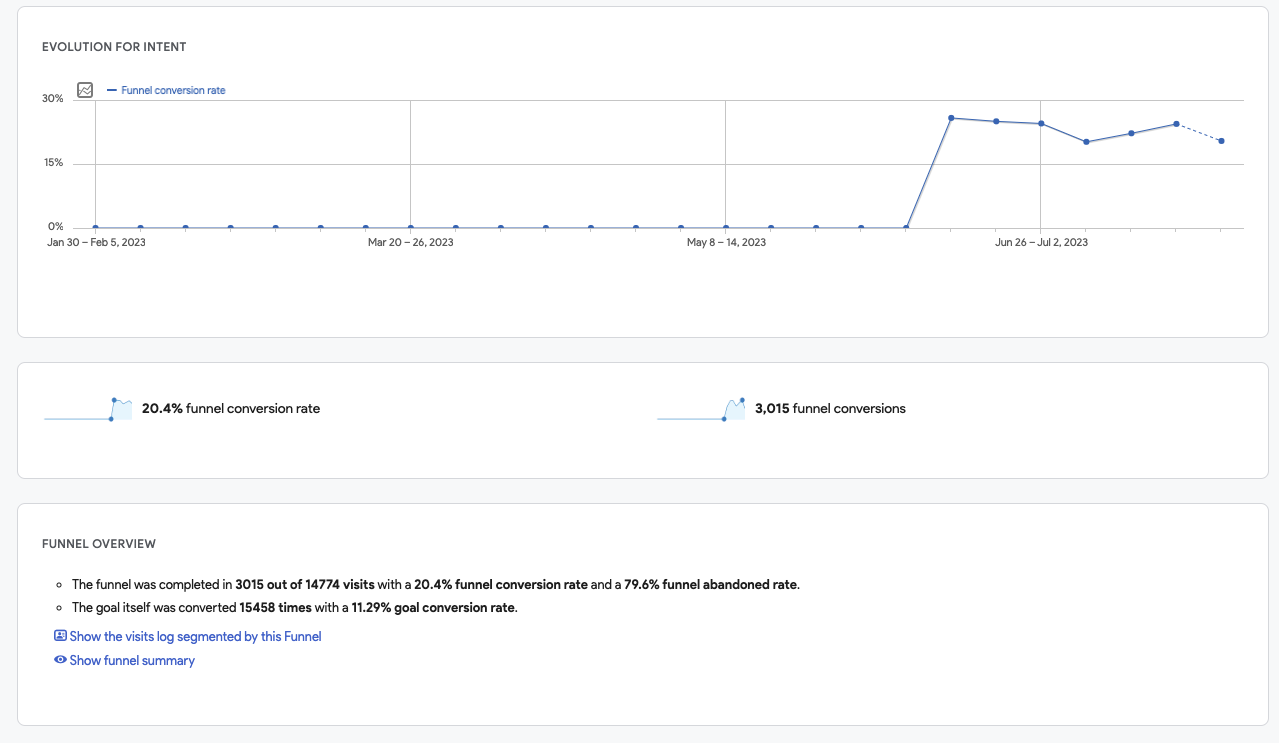
FunnelFuel uses machine learning models to automatically generate summaries and learnings from your funnels, such as this funnel overview;
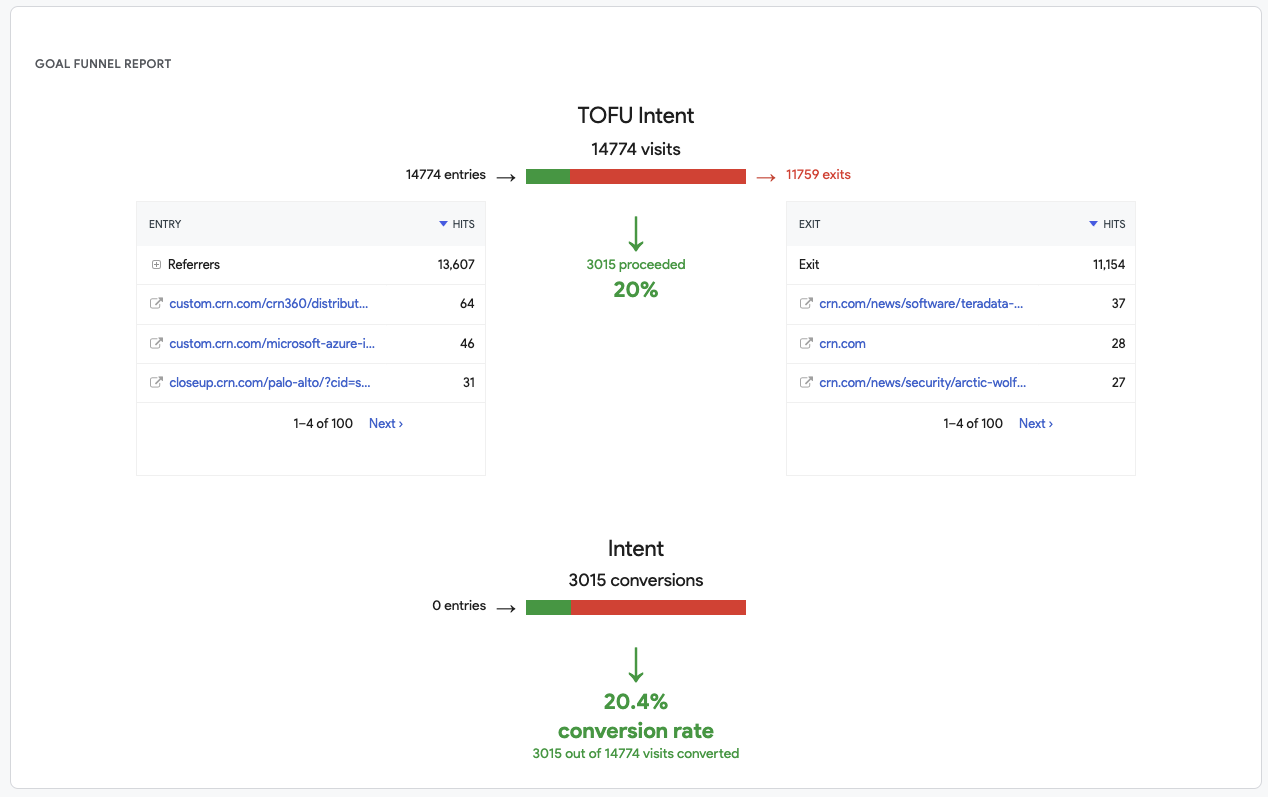
and this informative Journey Map;
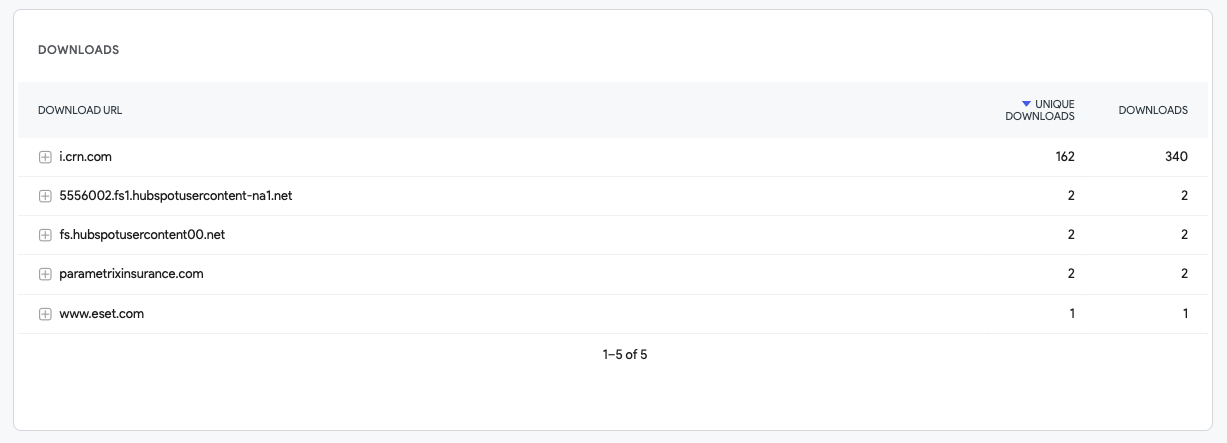
See which content, such as eBooks and Whitepapers has been downloaded by each named account
The below shows white paper based content which has been downloaded by Microsoft team members in 2023
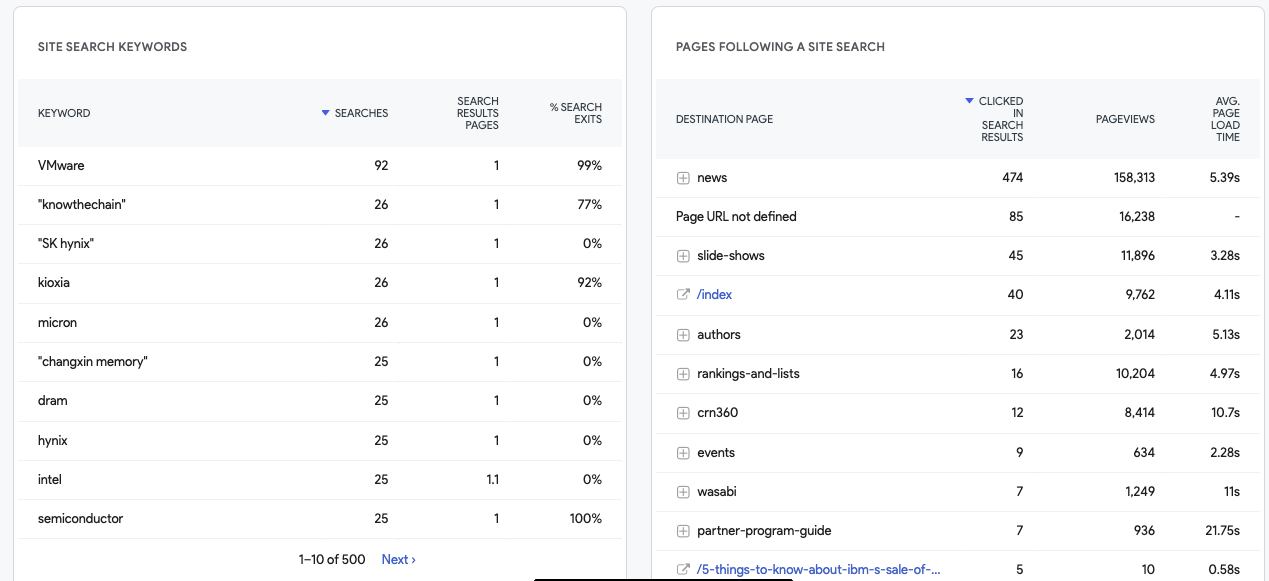
Measure account based Intent based on searches made on your website
This view shows the searches made by Microsoft in the last month, as well as the content they consumed having made the search. Search behaviour can provide a great proxy for intent
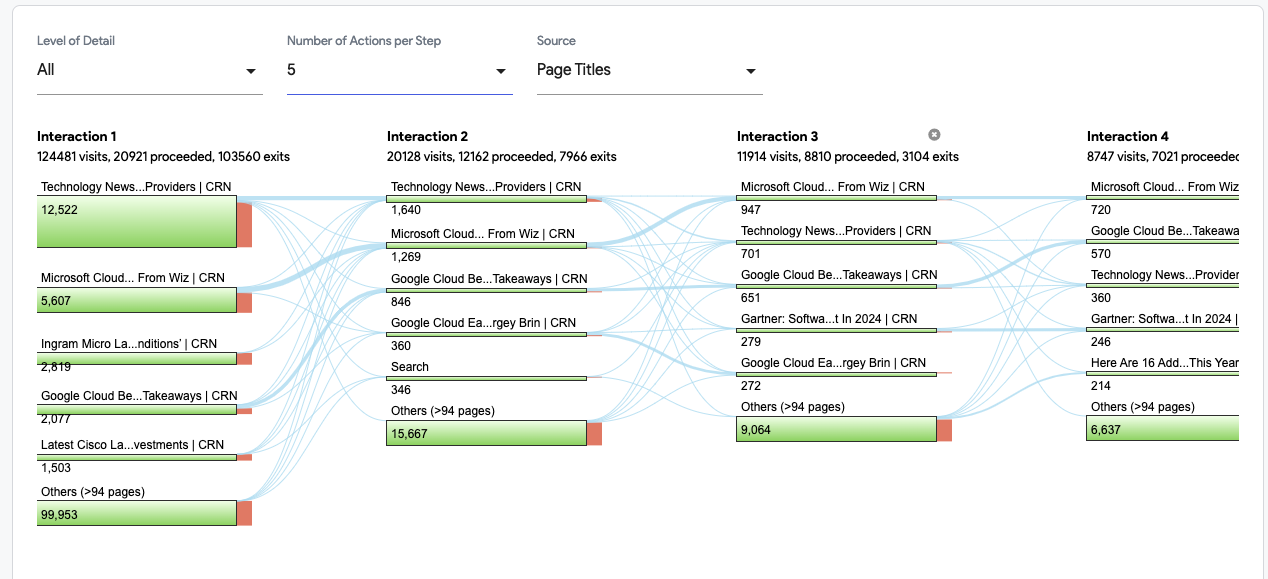
Measure user flow on an Account level
FunnelFuel, unlike Google Analytics measures 100% of web visits, and in the insight below, I have selected ‘All’ for the level of detail, and tracked the actions majoritively taken on site by a named account. This helps map out what each account is interested in, and what they are reading about the most
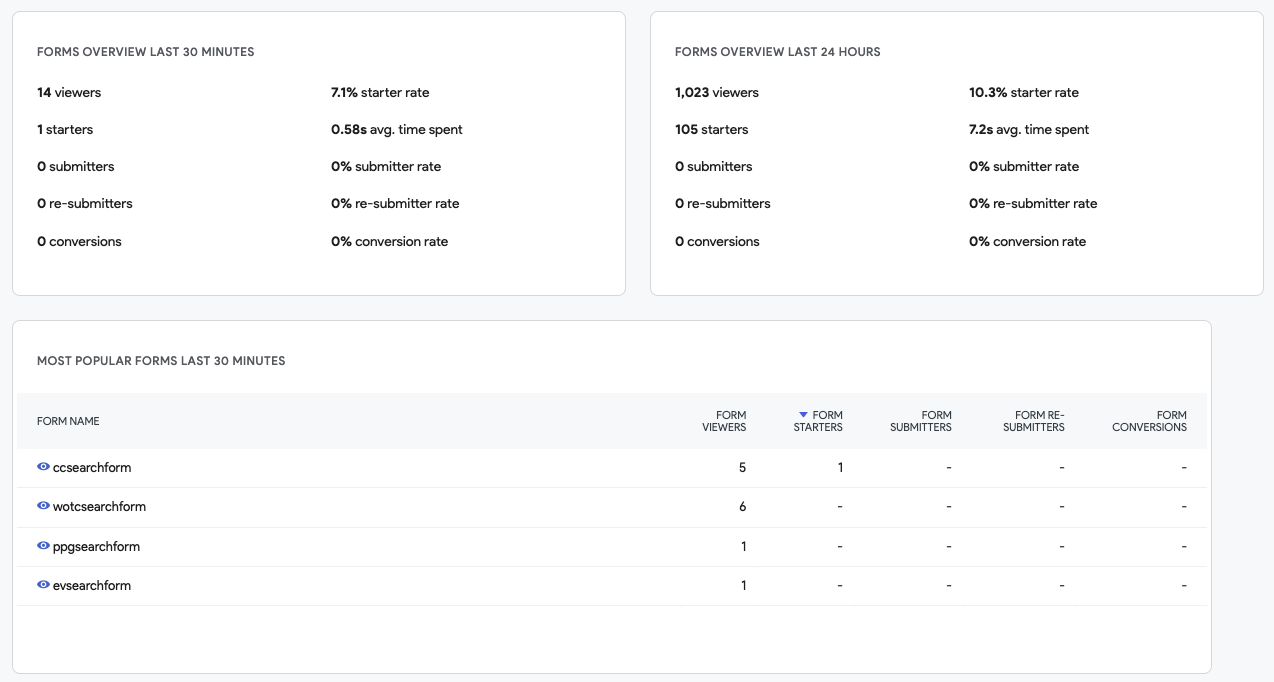
Get Real-Time views of your Form data – and locate which forms are causing drop-off with which accounts
Forms are a critical component of B2B marketing and FunnelFuel provides a lot of data around their performance.
This view gives an immediate wealth of insights into your forms, and how they’re performing. Different forms may work better with different firmographic segments, and you can get an account based lens over which forms are working and which aren’t.
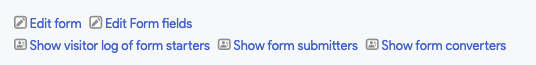
If you locate a form which is not performing, you can edit and enhance the form with tests within FunnelFuel. You can also pull up log-level analytics of those users who either started the form process or converted the form, ensuring you can get a quick and detailed overview of their path to conversion.
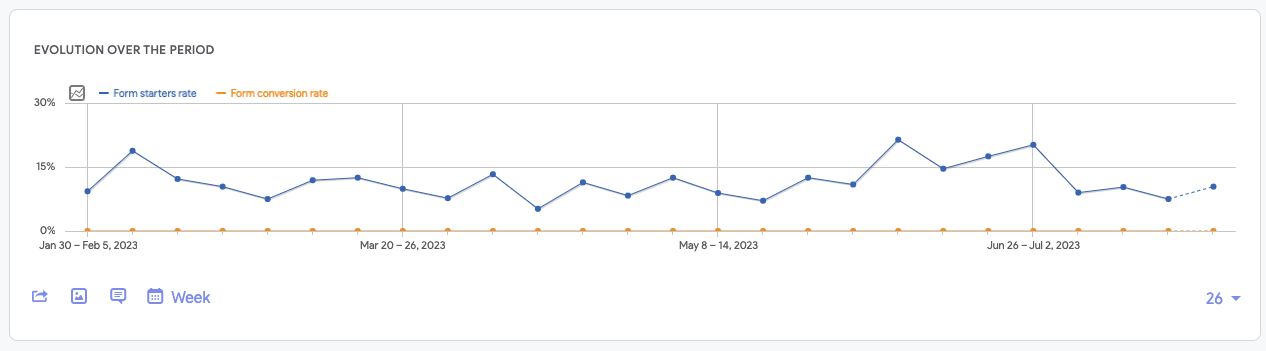
You can visually map form conversions over-time, ensuring that performance isn’t dropping or measure the impact of change – whether that is a change to the form itself or to your marketing activity. These views can be annotated within FunnelFuel, helping to ensure that you can plot the changes that you make;
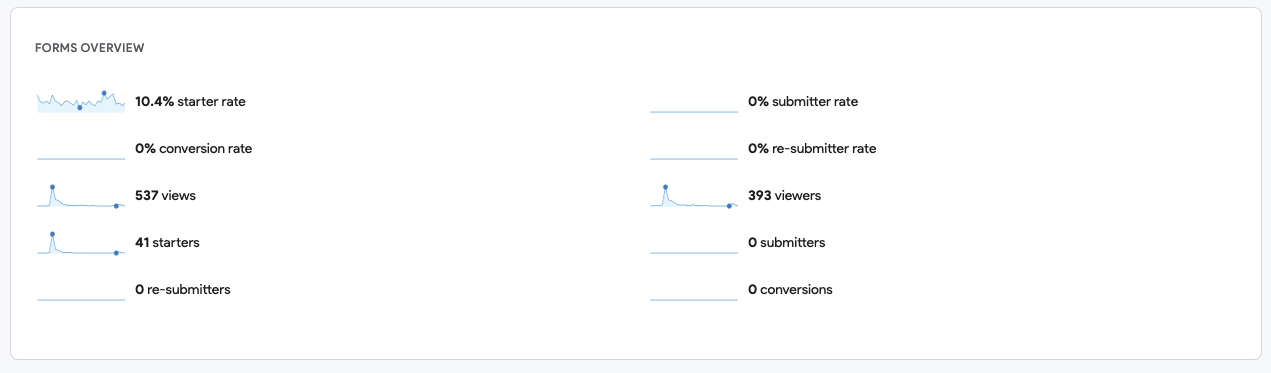
This form overview shows the key stats in terms of how your forms are working – including a de-duplicated view of conversions;
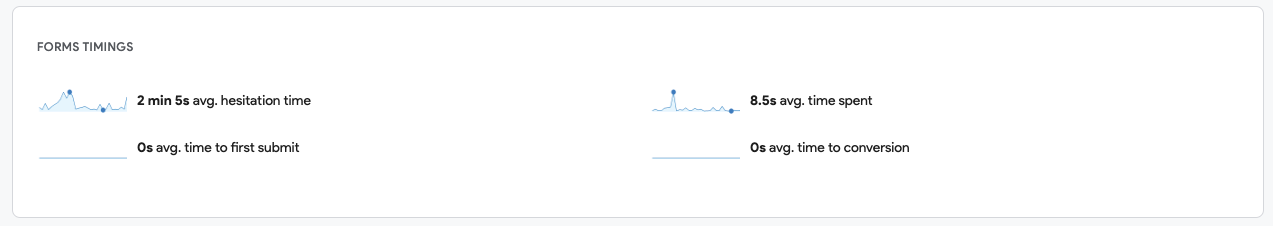
Our form timings insight can help improve your forms quickly – forms with a high hesitation time often contain a field of data that the user would rather not submit, such as phone number.
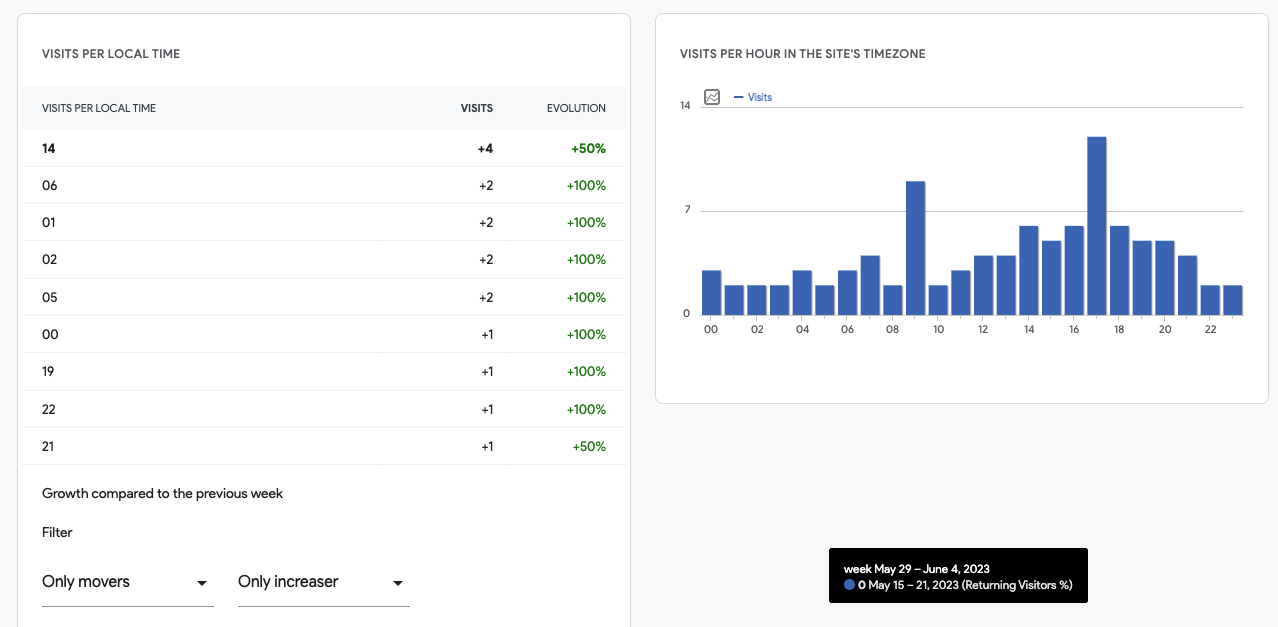
See which time of the day attracts specific named accounts to your site
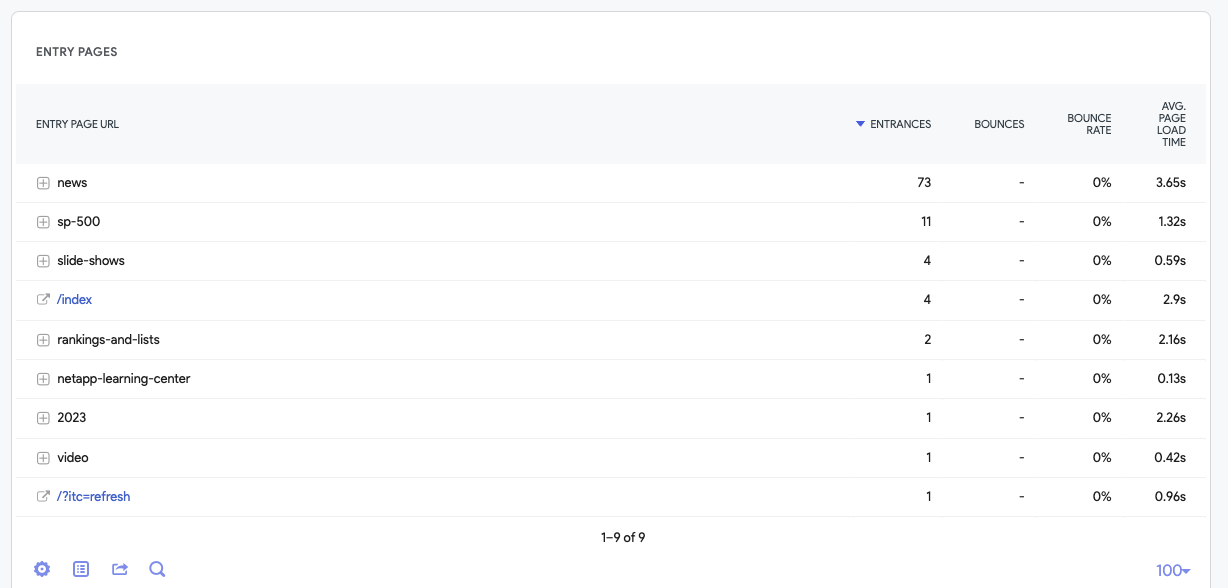
Measure which landing pages perform best on an account level;
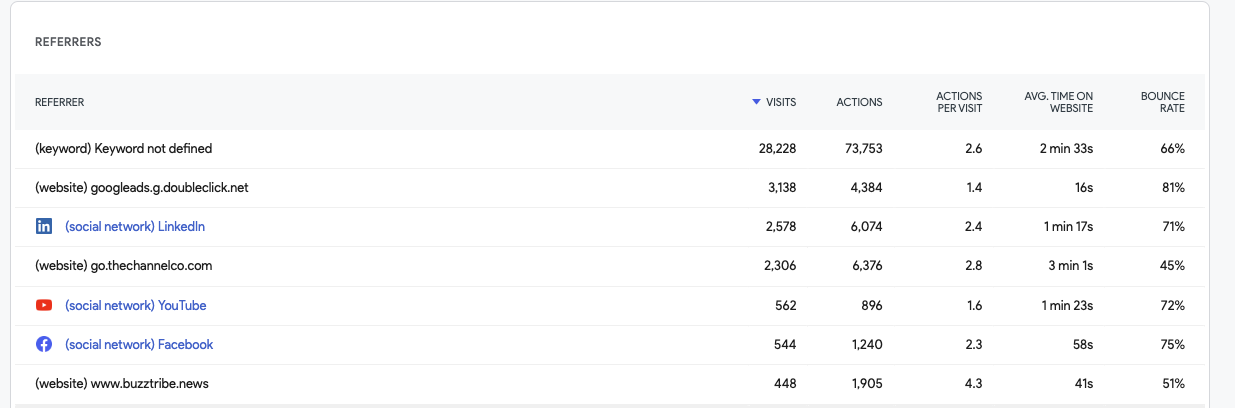
See all of the referral channels that drove named accounts to your website, across organic and paid media sources
Providing an overview of organic and paid traffic sources, and top-line stats around engagement depth;
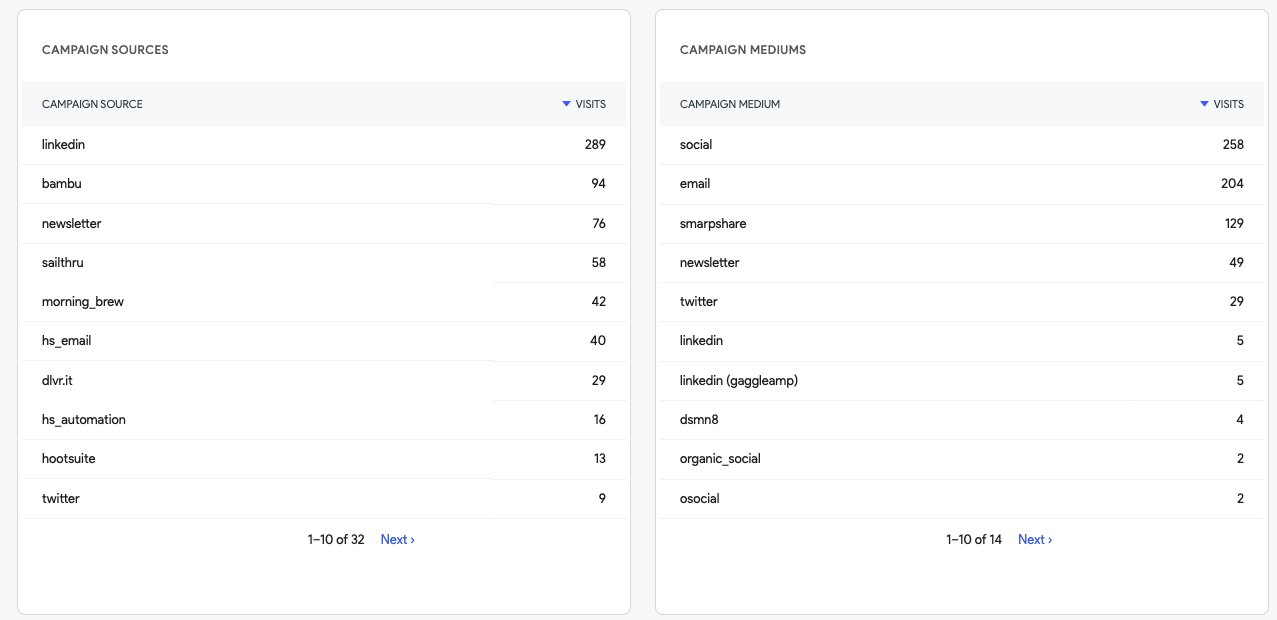
See which advertising campaigns have driven named accounts to your website
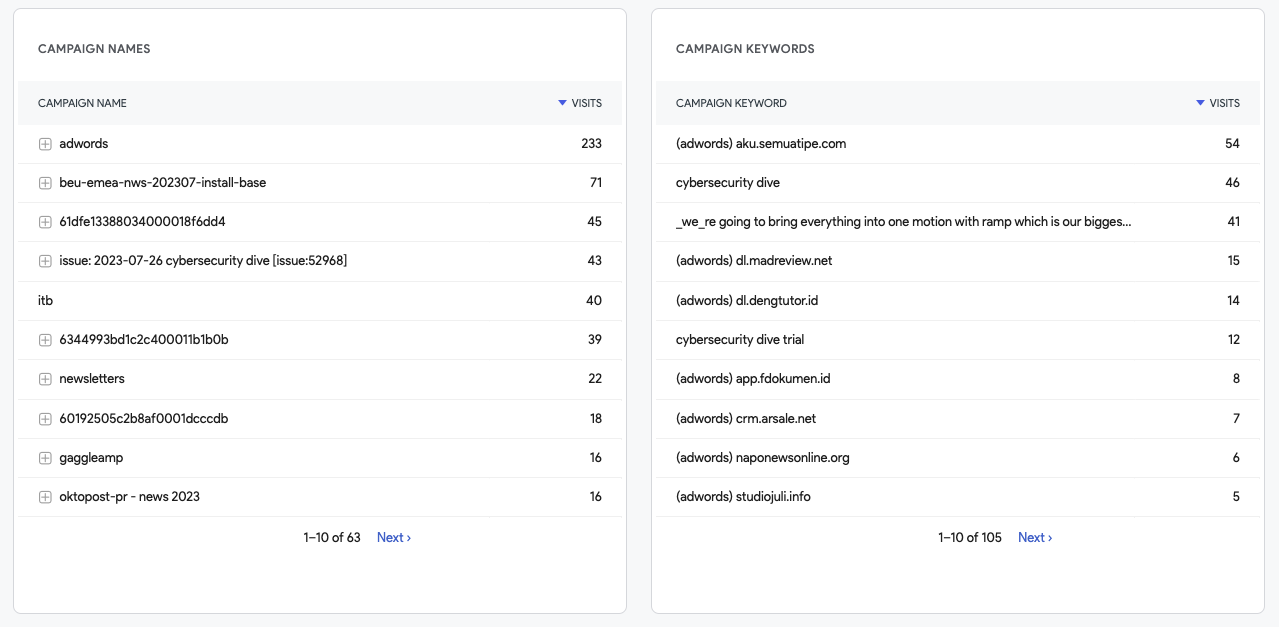
Including any UTM’s that you add for deeper clarity and optimisation
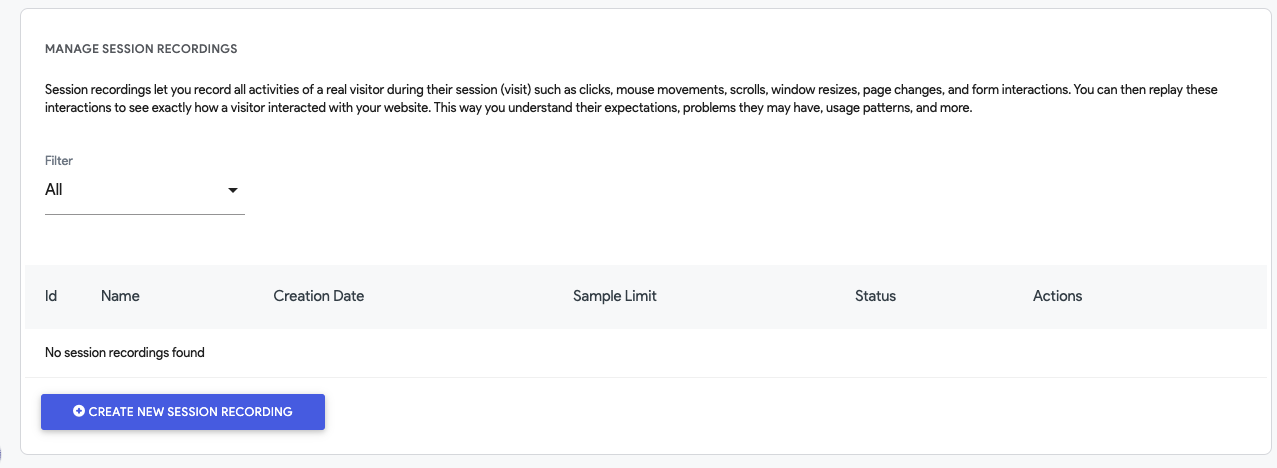
Create heatmaps showing named account activity, and how they have engaged with your site, and indicatively what they have and have not seen
and even view screen playbacks on named accounts behaviour on site